How to find the Orders Dashboard
To review orders:
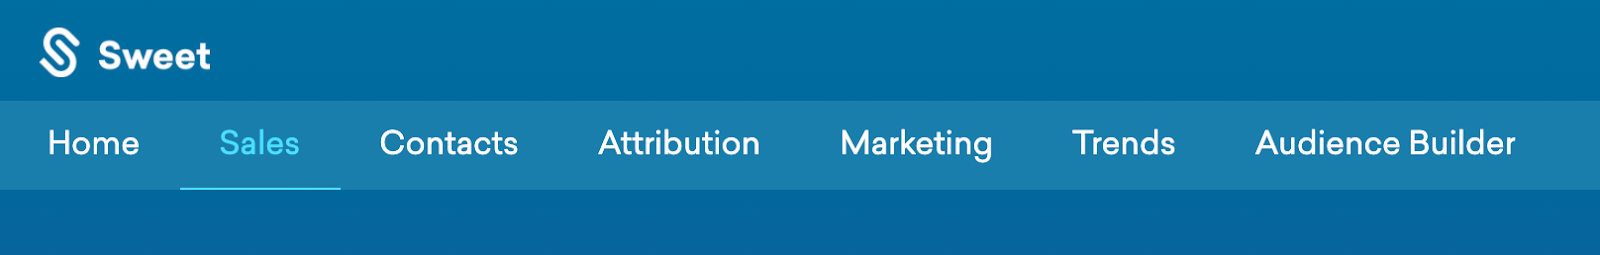
- Scroll back to the top of your dashboard to the navigation tabs
- Select category: Sales
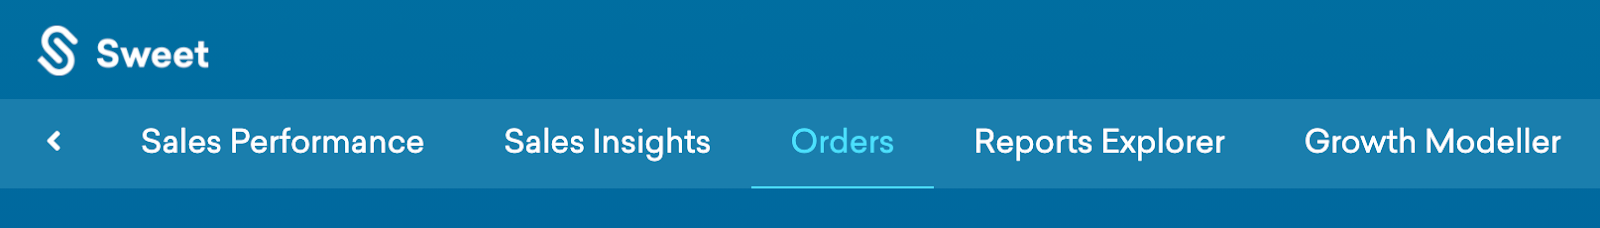
- Select sub category: Orders
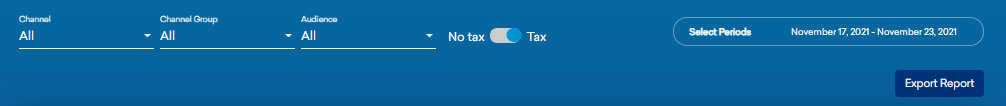
Use date picker to select your reporting time period. Click on the button to include or exclude vat.
You can also use the filters to select on Channel if you have multiple websites and stores. The default selects All.
The Audience filter also enables you to select and report on specific customer segments you have created in Audience Builder eg Champions.
Next you can go to the Advanced Filter to drill down for specific orders lists. Choose from Order ID, Name and Surname filters. You can select to show Refund Value or Refund percentage.

You can also change the attribution model reporting (11 options) to see which channels the orders are attributed to. Select your Attribution Model based on the following campaign goals:


Once you’ve selected your filters, the orders list below can be viewed on screen or exported in CSV or Excel format by clicking on the Export button below the date picker.
The data fields in the orders report are as follows:
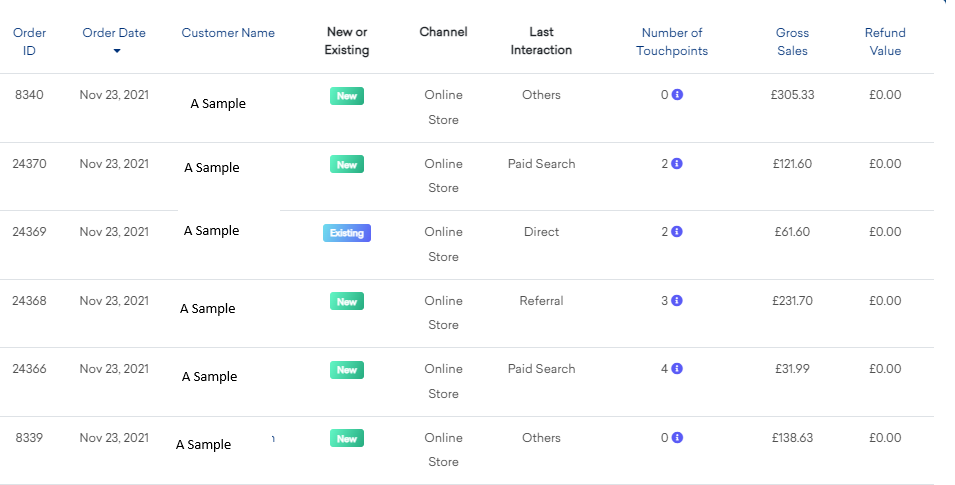
For each order line you will see the order ID, order date, customer name, New or Existing customer label (showing New or Existing customer status for the reporting period) plus channel summary eg online or store where the order was placed.
The next four columns all relate to the attribution method you have selected eg in the example above it is Last Interaction also known as Last Click. Next to it you will see the total number of touchpoints related to that order. Click on the icon next to the number to see which touchpoints the customer used eg ![]() Referral – Paid Search – Referral
Referral – Paid Search – Referral
Gross sales will be reported inc or exc tax as per your selection and Refund Value can be show as a value or a percentage.
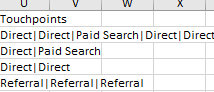
Exported Orders Report Template:

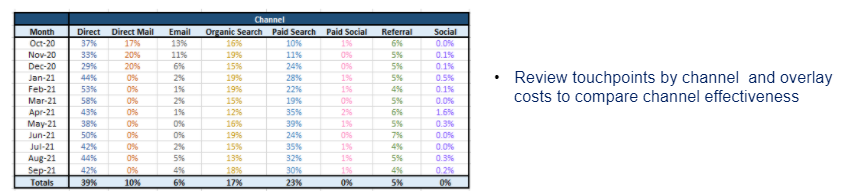
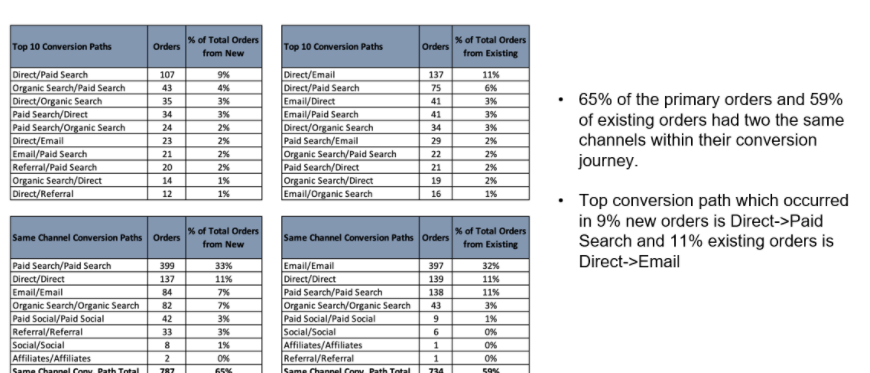
Once you have exported your data as shown in the template example above you can create some marketing channel and touchpoint analyses based on the attribution model you have selected. This will show you the relative importance of each marketing channel and the different combinations of touchpoints before order conversion.
Touchpoint Analysis How To Prep Your Touch Points Data:
- From your downloaded orders report, you will need to select separate out your touchpoints in column U. First highlight column U.
- Go to Data in top nav in your Excel ribbon select Text to Columns.

- Select Delimited.

- Click on Next to Step 2.

Here you will select Other and add the pipe symbol | into the box next to it and press Next. - The following pop up will show, select General.

Click on Finish and your touchpoints will all be shown in separate columns so you can do your touchpoint reporting using pivot tables to sort your data.
Marketing Channel and Touchpoint Analyses Example Reports
- Channel Touchpoint Overview
- Single Touchpoint Overview
- Multi Touchpoint Overview eg 2 Touchpoints
- Touchpoints Over Time